
Associate Professor, Dept of Anesthesia, GMC, Gondia
Pulmonary Function Test
Pulmonary function tests is a general term used to indicate a series of maneuvers or investigations that are performed to help measure lung functions. It evaluates one or more aspects of the respiratory system.
- Pulmonary parenchymal function/ Gas exchange (size & integrity of the pulmonary capillary bed)
- Respiratory mechanics
- Cardiopulmonary interaction
Although they do not provide a diagnosis per se, the abnormalities as observed in the tests performed aid in establishing the diagnosis..
Indications of PFT
- Evaluation of signs & symptoms like breathlessness, chronic cough, exertional dyspnea to detect the disease.
- Evaluate the extent and assess severity of disease.
- Screening at risk patients and follow their response to therapy
- Measure the effect of drugs on pulmonary function
- To assess preoperative risk
- Monitor pulmonary drug toxicity
Guidelines for ordering preoperative PFTs have been proposed by GM Tisi (1979) and more recently by the American College of Physicians (ACP). According to TISI GUIDELINES, following patients should undergo PFTs.
- • Age > 70
- Obese patients
- Thoracic surgery
- Upper abdominal surgery
- History of cough/ smoking
- Any pulmonary disease
The American College of Physicians (ACP) have modified the guidelines to decrease unnecessary ordering of preoperative spirometry
- Lung resection
- History of smoking, dyspnoea
- Cardiac surgery
- Upper abdominal surgery
- Uncharacterized pulmonary disease (defined as history of pulmonary disease or symptoms and no PFT in last 60 days)
Contraindications to the performance of spirometry are:
- History of recent thoraco-abdominal surgery
- Oral or facial pain which may be exacerbated by mouthpiece
- Stress incontinence
- Recent eye surgery
- Thoracic, abdominal and cerebral aneurysm
- Active haemoptysis
- Pneumothorax
- Dementia or confused patient,
- History of myocardial infarction within one month /Unstable angina
PFTs can be divided in various categories
- Mechanical Ventilatory Functions of Lung / Chest wall Bedside pulmonary function tests.
- Respiratory rate: This is a very vital but undervalued component in the battery of PFTs. It is an important evaluator in weaning and extubation protocols. Increase in respiratory rate leads to muscle fatigue contributing to work load to respiratory efforts and hence failure of weaning.
- Sabrasez breath holding test: The patient is asked to take a full but not too deep a breath and hold it as long as possible.
- > 25 s – Normal cardiopulmonary reserve
- 15 – 20 s – Limited cardiopulmonary reserve
- < 15 s – Very poor cardiopulmonary reserve
The length of time can crudely help to quantify the Vital capacity of the patient.
- 25 -30 s – 3500 ml
- 20 -25 s – 3000 ml
- 15 – 20 s – 2500 ml
- 10 -15 s – 2000 ml
- 5 – 10 s – 1500 ml

- Sabrasez single breath count: The patient is asked to take a deep breath followed by counting 1, 2, 3…… till he/she cannot hold breath. A count till 30-40 depicts a normal vital capacity. It also indicates the trend of deteriorating or improving pulmonary function in the pre and postoperative patients.
- Sneider’s match blowing test: This measures the Maximum Breathing Capacity. The patient is asked to blow a match stick from a distance of 6” (15 cm) with mouth wide open, chin rested / supported, with no purse lipping and head movement. There should be no air movement in the room with mouth and match at the same level. The patient should be allowed to take 6 attempts before interpretation of test.
If the patient can blow out the match, then MBC > 60 l/min and with a FEV1 > 1.6 l and if unable to do so, then vice versa.
The modified Match stick test by Olsen, helps to estimate the MBC by establishing a relationship between the distance at which the match stick is blown out and the MBC of the patient. A distance of 9” predicts an MBC of 150 L/min, 6”, 60 L/min and 3”(8 cm), an MBC of 40 L/min. - Greene and Berowitz cough test: The patient is asked to take a deep breath followed by a cough. The ability to cough determines the strength and effectiveness of the respiratory muscles. An effective cough would warrant a VC equivalent to 3 times TV. If unable to do so, an FVC of < 20 ml/min, FEV1 < 15ml/kg and PEFR < 200ml/min can be extrapolated.
If the patient has a wet productive cough or has paroxysms of coughing, then he/she is susceptible to post operative pulmonary complications. - Forced Expiratory time: The patient is asked to take a deep breath and told to exhale maximally and forcefully. A stethoscope is kept on the trachea and exhalation sounds are appreciated.
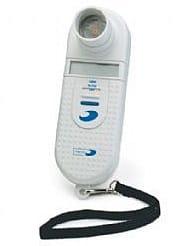
Normally the sounds are heard for 3-5 s. If < 3 s, then a restrictive type of disease may be present and > 6 s, then an obstructive lung disease may be present. - De BONO Whistle blowing test: This measures the PEFR (Peak Expiratory flow rate). The patient blows a wide bore tube, at the end of which is a whistle, on the side a hole with adjustable knob. As the patient blows down the tube, the whistle sounds only when the rate of airflow exceeds a certain value. The side leak hole is gradually increased till the sound of whistling disappears. The last position when the whistle can be appreciated is read off the scale and taken as the PEFR.
- Wright’s spirometer: This is bed side instrument which helps to measure the Tidal Volume and Minute Volume of the patient. Simple and quick assessment is the advantage and the instrument is light, compact and portable and can be connected to an endotracheal tube or face mask. The vital disadvantage is that it under reads at low flow rates and over reads at high flow rates.
Ideally done in the sitting position, the patient is asked to breathe through the instrument for one minute and the respiratory rate is noted. The minute ventilation is recorded and read directly from the instrument. The TV is calculated by dividing the MV by Respiratory rate. A fairly accurate measurement can be obtained within the range of 3.7 to 20 L (± 10%). It is very useful tool for bedside PFT and in ICU during weaning off patients from the ventilator. - Micro spirometers: these help to measure VC, but are costly.
- Bed side – Pulse Oximetry
- ABG: Gives important information regarding gas exchange and oxygen delivery to the tissues. Type 1 respiratory failure is defined as PaO2 < 8 kPa with normal PaCO2 as in pneumonia and pulmonary embolism.
Type 2 occurs when hypoxia is accompanied with hypercapnia (PaCO2 >6.5 kPa). This is observed in ventilator failure as in respiratory muscle weakness and COPD.


LUNG VOLUMES AND CAPACITIES:
Spirometry: This is the cornerstone of all the PFTs. Spirometry is a medical test that measures the volume of air an individual inhales or exhales as a function of time.
John Hutchinson invented the spirometer. Modern spirometers with the computer technology render distinct advantage over the earlier generation spirometers. They are programmed to detect factors that can affect readings and results like cough, late peak flows, premature effort termination and variation in manoeuvres.
Before beginning the study, one must be sure that the patient is able to follow instructions. Following precautions are to be observed-
- Patient should avoid wearing tight clothes which may restrict the chest movements and abdominal expansion and be instructed against smoking, alcohol consumption, vigorous exercises, or eating large meals 2 to 4 hours prior to test.
- Data gathered prior to testing include patient age, height, weight, gender, time of day and ethnicity (Variation in measured lung functions can be attributed to these factors)
- Transmission of infection should be avoided by strictly adhering to hygiene and infection control measures.
- Unobstructed mouth piece: Remove prosthetic loose dentures if any, put mouth piece over the tongue.
- Maximum inspiration.
- Smooth continuous expiration with maximal effort.
- Body position has a significant impact on spirometry, especially FVC and vital capacity. The values are 8% and 2% lower, respectively, in supine and sitting position, compared to standing being the preferred position. Increased peak expiratory flow is seen in hyper-extension of the neck due to elongation and stiffening of the trachea. Flexion of the neck decreases peak flow and increases airway resistance.
Spirometry is effort dependant and suboptimal results may be obtained if patient has chest or abdominal pain due to any cause or unable to follow instructions. Due to the risk of cross infection, patients with active respiratory infections such as tuberculosis, are deferred but not precluded. If absolute necessity prevails, then precautions like performing PFTs at the end of the end, tests performed in the patient’s room, reserving equipment for sole use in such patients and decontamination of equipment immediate after use must be undertaken.
STATIC LUNG VOLUMES AND CAPACITIES:
Static lung volumes are determined using methods in which airflow velocity does not play a role. The sums of two or more lung volume subdivision constitute a lung capacity and are expressed in liters(L) at body temperature.
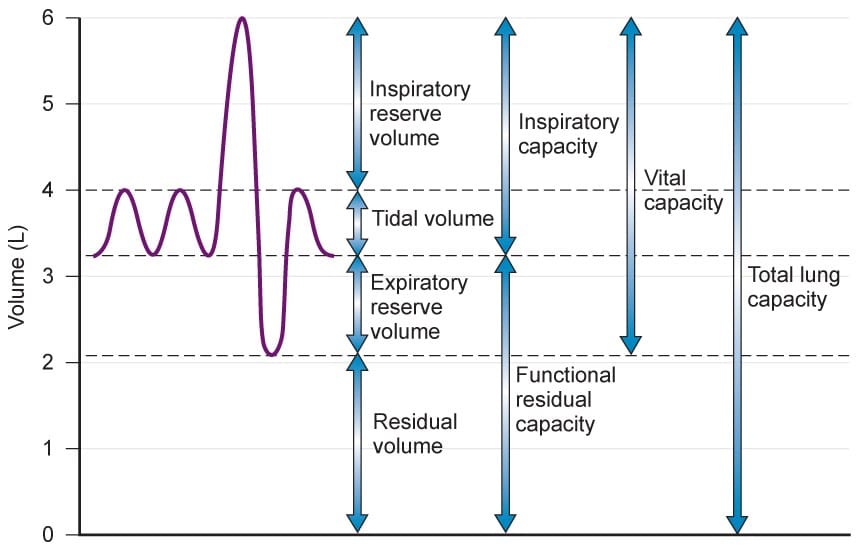
PFT tracings have:
- Four Lung volumes: Tidal volume (TV), Inspiratory reserve volume (IRV), expiratory reserve volume (ERV), and residual volume (RV)
- Five capacities: inspiratory capacity (IC), expiratory capacity (EC), vital capacity (VC), functional residual capacity (FRC), and total lung capacity (TLC)
- Tidal Volume (TV): The volume of air inhaled or exhaled with each breath during quiet breathing. It is about 6‐8 ml/kg and 500 ml in average 60 kg patient.
- Inspiratory Reserve Volume (IRV): It is the maximum volume of air inhaled from the end‐ inspiratory tidal position. It is taken to be 3000 ml.
- Expiratory Reserve Volume (ERV): It is the maximum volume of air that can be exhaled from resting end‐expiratory tidal position and is about 1500 ml.
- Residual Volume (RV): – Volume of air remaining in lungs after maximium exhalation (20‐25 ml/kg) 1200 ml – Indirectly measured (FRC‐ ERV) – It can not be measured by spirometry.
- Total Lung Capacity (TLC): It is the sum of all volume compartments or volume of air in lungs after maximum inspiration (4‐6 L).
- Vital Capacity (VC): TLC minus RV or maximum volume of air exhaled from maximal inspiratory level is VC. It is calculated to be (60‐70 ml/kg) 5000ml. VC ~ 3 TIMES TV FOR EFFECTIVE COUGH.
- Inspiratory Capacity (IC): The sum of IRV and TV or the maximum volume of air that can be inhaled from the end‐expiratory tidal position is IC. (2400‐3800ml).
- Expiratory Capacity (EC): TV+ ERV
- Functional Residual Capacity (FRC): The volume of gas present in the lung at end expiration during tidal breathing, is the FRC and a key component in the measurement of lung volumes. It is the sum of RV and ERV (30‐35 ml/kg) i.e. 2500 ml.
It functions as-
- Oxygen store
- Buffer for maintaining a steady arterial pO2
- Partial inflation helps prevent atelectasis
- Minimizes the work of breathing
FRC Decreases –
- In supine position(0.5‐1L)
- Obese patients
- Induction of anesthesia: by 16‐ 20%
- Increase in age
FRC can be assessed by following methods:
NITROGEN WASHOUT METHOD (open- circuit method using N2): This technique was introduced in 1940 by Darling, Cournand and Richards. In this method the patient breathes 100% oxygen for 7 minutes and during this period Nitrogen concentration in expired air is measured. When the N2 level falls to zero, all N2 present in the lungs at the beginning of the test has been washed out. The total volume of gas expired and N2 in the expired gas is measured.
FRC= (volume of N2 washed out) – (N2 tissue extraction) / initial – final N2 concentration.
N2 tissue extraction is calculated as (Body Surface Area x 96.5) + 35/ 0.8
HELIUM DILUTION METHOD: This is a closed circuit method using helium. The system is readied by adding 2L of air and sufficient helium to achieve concentration of approximately 10% helium. The patient re-breathes from the closed circuit. The CO2 is absorbed by absorbent while O2 is added through valve. As the helium mixes with the air in the lungs its concentration falls. Stabilization of the helium concentration indicated by a rate of change of less than 0.02 percent over 30 sec interval, indicates helium concentration has equilibrated through the lung breathing circuit system, which is usually achieved in 7 minutes.
FRC = Initial He % – Final He % / Final He %
BODY PLETHYSMOGRAPHY: Plethysmography is derived from Greek word meaning enlargement. It is based on principle of BOYLE’S LAW (P V = constant). The priniciple advantage over other two methods is it quantifies non ‐ communicating gas volumes.
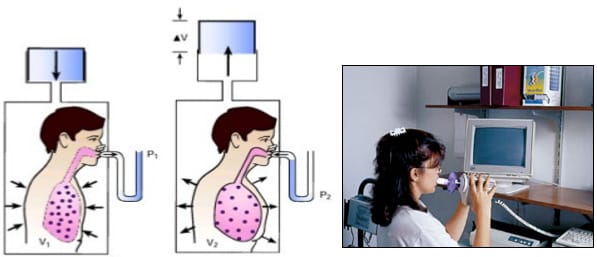
A patient is placed in a sitting position in a closed body box with a known volume. The patient pants with an open glottis against a closed shutter to produce changes in the box pressure proportionate to the volume of air in the chest. Measurements done at end of expiration, it yields FRC.
FORCED SPIROMETRY / TIMED EXPIRATORY SPIROGRAM
Includes measuring the pulmonary mechanics in order to assess the ability of the lungs to move large volumes of air quickly through the airways to identify airway obstruction
- FVC
- FEV1
- Several FEF values
- Forced inspiratory rates(FIF’s)
- MVV
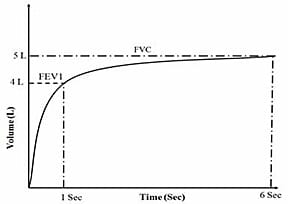
FVC : The FVC is the maximum volume of air that can be breathed out as forcefully and rapidly as possible following a maximum inspiration. It is characterized by full inspiration to TLC followed by abrupt onset of expiration to RV and indirectly reflects flow resistance property of airways.
Taking into consideration factors like age, sex and ethnicity, the value of FRC is predicted and the Forced spirogram is interpreted as the percentage of the predicted.
If, 80-120% of predicted – Normal, 70-79% – Mild reduction and 50%-69% – Moderate reduction.
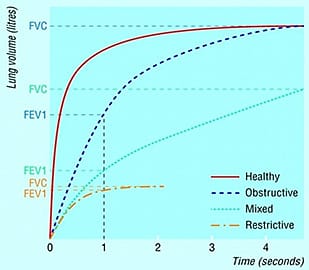
FEV1: Forced expiratory volume in 1 sec is the volume exhaled during the first second of the FVC manoeuvre. It is a useful measure of how quickly the lungs can be emptied and thus measures the general severity of the airway obstruction. The normal value ranges from 3 ‐ 4.5 L.
A decreased value is observed in both obstructive and restrictive lung disorders (as patient’s vital capacity is smaller than predicted FEV1).
FEV1/FVC: When FEV1 is expressed as a percentage of the FVC, it gives a clinically useful index of airflow limitation. Reduced values are observed in obstructive disorders. Interpretation done as per % of predicted: >75% -Normal, 60% ‐ 75% Mild obstruction and 50% ‐ 59% depicts moderate obstruction.
Forced Expiratory Flow at 25% of FVC (FEF25%). The FEF25% is the flow rate at the 25% point of the total volume (FVC) exhaled. Assuming maximal effort this flow rate is still indicative of the condition of fairly large to medium size bronchi. This landmark is used in calculations with the FEF75% to give FEF25-75%.
Forced Expiratory Flow at 50% of FVC (FEF50%). The FEF50% is the flow rate at the 50% point of the total volume (FVC) exhaled. This landmark is at the midpoint of the FVC and indicates the status of medium to small airways. It is sometimes looked at instead of the FEF25-75%.
Forced Expiratory Flow at 75% of FVC (FEF75%). The FEF75% is the flow rate at the 75% point of the total volume (FVC) exhaled. This landmark indicates the status of small airways and is used in the FEF25-75% calculation. The damage done by most chronic pulmonary diseases show up in the smallest airways first and early indications of this damage begin to appear toward the end of the expiratory part of the Flow Volume Loop.
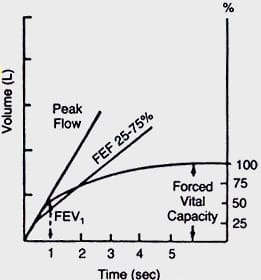
Forced Expiratory Flow at 25-75% of FVC (FEF25-75%): It is the mid-half of the FVC, which is independent of patient’s effort and an indicator for obstruction in the small airways. This value is very dependent on the total volume exhaled (FVC) and tends to be highly variable from test to test. Normal value is 4.5 – 5 l/s Or 300 l/min.
Interpretation of % predicted: > 60% – Normal, 40 ‐ 60% – Mild obstruction, 20 ‐ 40% – Moderate obstruction, <10% – Severe obstruction
Peak Expiratory Flow Rate: Maximum flow rate during an FVC manoeuvre occurs in initial 0.1 s and the expiratory flow at this time is termed as PEFR. After a maximal inspiration, the patient expires as forcefully and quickly as he can and the maximum flow rate of air is measured. The forced expiratory flow between 200‐1200ml of FVC is the PEFR. It gives a crude estimate of lung function, reflecting larger airway function. Though being effort dependant it is highly reproducible.
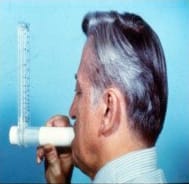
It is measured by a peak flow meter, which measures how much air (litres per minute) is being blown out or by spirometry. The peak flow rate in normal adults varies depending on age and height. The normal is 450 ‐ 700 l/min in males and 300 ‐ 500 l/min in females. Values of <200 l depict impaired coughing and hence likelihood of postoperative complications.
Maximum Voluntary Ventilation (MVV) or maximum breathing capacity
(MBC): It measures the speed and efficiency of filling & emptying of the lungs during increased respiratory effort. The maximum volume of air that can be breathed in and out of the lungs in 1 minute by maximum voluntary effort is MVV. It reflects peak ventilation in physiological demands. The normal value is 150 ‐175 l/min.
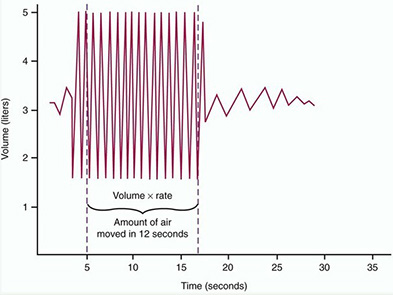
The subject is asked to breathe as quickly and as deeply as possible for 12 s and the measured volume is extrapolated to 1min. As a general guide, the value should correlate closely to the FEV1 x 35.
Periods longer than 15 s should not be allowed because prolonged hyperventilation leads to fainting due to excessive lowering of arterial PCO2 and H+. MVV is markedly decreased in patients with Emphysema, Airway obstruction and with poor respiratory muscle strength.
This test is usually performed whenever spirometry is done. If people have weakness in the muscle of breathing this test can help identify these difficulties. The MVV is a test of ultimate effort dependency and is often discarded by physicians. Since it has been shown that the FEV1 x 35 is a good indication of MVV, many centers simply report that result. Disability criteria however still require an actual MVV to be done!
Respiratory Muscle Strength (MIP & MEP)
A number of motor neuron diseases, resulting in respiratory muscle weakness can lead to respiratory failure. These affect not only the chest wall but the diaphragm too. Serial VC may help to diagnose diseases like Guillan Barre Syndrome. A fall in VC below 1 l warrants mechanical support in such patients.
Inspiratory mouth pressures: This measures inspiratory muscle function wherein the patient generates as much as inspiratory pressure against blocked mouth piece. The pressure generated (Maximum inspiratory pressure – MIP) is therefore a function of inspiratory muscle rather than lung volumes and does not change significantly throughout the test. The normal value is 100cm-H2O. A value > 80 cm-H2O exclude inspiratory muscle weakness.
Expiratory mouth pressures: This measures expiratory muscle function wherein the patient generates as much as expiratory pressure against blocked mouth piece. The pressure generated (Maximum expiratory pressure – MEP) The test is often called MIP/MEP – maximum inspiratory and expiratory pressure.
A fall in VC by > 25% in supine position to erect position indicate diaphragmatic paralysis (Normal decrease in VC from erect to supine is 5%)
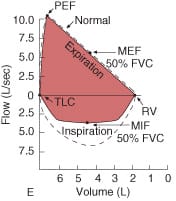
FLOW VOLUME LOOPS
“Spirogram” is the Graphic analysis of flow at various lung volumes. The tracing is obtained when a maximal forced expiration from TLC to RV is followed by maximal forced inspiration back to TLC. It measures forced inspiratory and expiratory flow rate, augments spirometry results. The principal advantage of flow volume loops vs. typical standard spirometric descriptions is identification of the probable obstructive flow anatomical location.
First 1/3rd of expiratory flow is effort dependent and the final 2/3rd near the RV is effort independent. The Inspiratory curve is entirely effort dependent. The ratio of maximal expiratory flow (MEF) /maximal inspiratory flow (MIF) is the mid VC ratio and is normally ‘1’.

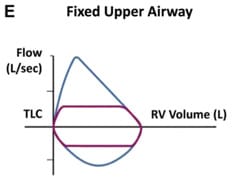
Flow‐volume loops provide information on upper airway obstruction such as fixed obstruction. There is a constant airflow limitation on inspiration and expiration as in Benign stricture of trachea, Goiter, Endotracheal neoplasms, and bronchial stenosis.
Variable intrathoracic obstruction: A flattening of expiratory limb is observed eg. Tracheomalacia, Polychondritis, Tumors of trachea or main bronchus. During forced expiration, high pleural pressure develop causing an increased intrathoracic pressure, thereby decreasing airway diameter. The flow volume loop shows a greater reduction in the expiratory phase. During inspiration, lower pleural pressure around airway tends to decrease obstruction.
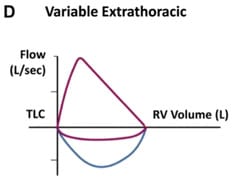
Variable extrathoracic obstruction: A forced inspiration causes negative transmural pressure inside the airway which tends to collapse it. During expiration, positive pressure in airway decreases obstruction. Hence, inspiratory flow is reduced to a greater extent than expiratory flow. This can be observed in Bilateral and unilateral vocal cord paralysis, Vocal cord constriction, Chronic neuromuscular disorders, Airway burns and Obstructive sleep apnoea.
Common Obstructive Airway Disease:
ASTHMA: Peak expiratory flow is reduced hence maximum height of the loop is reduced. As the airways narrow, airflow reduces rapidly and the loop becomes concave. Concavity may be the indicator of airflow obstruction and may present before the change in FEV1 or FEV1/FVC.
EMPHYSEMA: The airways collapse during forced expiration because of destruction of the supporting lung tissue leading to reduced flow at low lung volume. A characteristic (dog‐leg) appearance to the flow volume curve is observed.
REVERSIBILITY: The improvement in FEV1 by 12‐15% or 200 ml on repetition of spirometry after treatment with Sulbutamol 2.5mg or ipratropium bromide by nebuliser after 15‐30 minutes is reversibility. It is a characteristic feature of B. Asthma whereas in chronic asthma there may be only partial reversibility. In COPD, the airflow is irreversible although some cases may show significant improvement.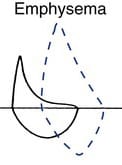
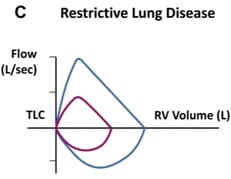
RESTRICTIVE PATTERN: This is characterized by reduced lung volumes /decreased lung compliance. There is reduction in TLC, FRC, RV. Spirometric study may depict low FVC while FEV1/FVC is often normal or greater than normal due to the increased elastic recoil pressure of the lung. Peak expiratory flow may be preserved or even higher than predicted leading to tall, narrow and steep flow volume loop in expiratory phase. Examples are Interstitial Fibrosis, Scoliosis, Obesity, Lung Resection, Neuromuscular diseases, Cystic Fibrosis.

TESTS FOR GAS EXCHANGE FUNCTION:
ALVEOLAR‐ARTERIAL O2 TENSION GRADIENT: Sensitive indicator of detecting regional V/Q inequality. The Normal value at room air ranges from 8 mmHg in young adults up to 25 mmHg in 8th decade (decrease in PaO2). Abnormally high values at room air is seen in asymptomatic smokers & Chr. Bronchitis (minimum symptoms)
A‐a gradient = PAO2 ‐ PaO2 * PAO2
PaO2 = arterial PO2 (measured in arterial gas)
PAO2 = (PB ‐ PH2O)*FiO2 ‐ (PaCO2/RQ) – alveolar gas equation
Diffusion Capacity: It implies the maximum transfer ability of the lung and is governed by its structural and functional properties. The gas has to travel through several barriers as it moves from the alveolus to the haemoglobin binding site, hence the term transfer factor. This depends on thickness of alveolar—capillary membrane, haemoglobin concentration & cardiac output, with normal being 20‐30 ml/min/mm Hg.
It is commonly determined by the use of CO, as its uptake is easy to measure and it follows the same diffusion pathway that of oxygen. The manoeuvre begins with unforced exhalation to residual volume followed by a rapid and good inspiratory effort to ensure instantaneous lung filling and the inspired volume being 85 to 90% of vital capacity. The breath is then held for 10 to 12 s. Slower lung fillings reduces CO uptake and a sub maximal effort from residual volume reduces alveolar volume and produces low DLCO.
The basic equation used to calculate DLCO is:
DLCO = Vco/PACO-PCCO, where: Vco is rate of disappearance of CO, PACO is alveolar concentration of CO, PCCO partial pressure of CO in blood.
CARDIOPULMONARY INTERACTION
Non-invasive techniques which are effort dependent help to test the ability of patient’s physiological response to cope with metabolic demands.
Stair climbing: This is a simple test that is easy to perform with minimal equipment. It is interpreted as in the following table:
| Performance | VO2 max (ml/kg/min) Maximal O2 consumption | Interpretation |
|---|---|---|
| >5 flight of stairs | > 20 | Low mortality after pneumonectomy & FEV1>2l |
| >3 flight of stairs | Low mortality after lobectomy, FEV1>1.7l | |
| >2 flight of stairs | Correlates with high mortality | |
| >1 flight of stairs | <10 |
6 min walk test: The 6MWT is a practical simple test that only requires a 100-ft hallway. Walking is an activity performed daily by all but the most severely impaired patients. This test measures the distance that a patient can quickly walk on a flat, hard surface in a period of 6 minutes (the 6MWD). As a relatively simple measure of aerobic exercise capacity, the 6MWT has been utilized in a variety of medical conditions affecting the cardiopulmonary system. It should be recognized that the test is a global assessment and does not specifically identify the respiratory system as the source of the limitation. A 6MWT < 600 m corresponds to a VO2max of 15 ml/kg/min.
Shuttle walk: The incremental shuttle walk test (ISWT) was developed in order to assess the functional exercise capacity of patients with COPD. The test subject walks back and forth along a 10-m flat course, with progressive increases in pace imposed by audio signals, until no longer able to maintain the pace. The incremental character of the ISWT yields physiological responses closer to those observed in cardiopulmonary exercise testing (CPET). The incremental shuttle walk distance (ISWD) is generally used as an index of cardiorespiratory fitness and has been suggested as a prognostic indicator in patients with chronic disease. Distance less than 250 m or decrease in SaO2 > 4% signifies high risk. A shuttle walk of 350m correlates with a VO2 max of 11ml/kg/min.
CONCLUSION: PFTs is an important tool which add to or aid in exclusion of a diagnosis. A combination of patient’s clinical history as well as supporting data with required knowledge of interpretation of tests will help in proper evaluation of patient prior to surgery and develop an anaesthetic plan of management for better outcome.
References:
- Ranu H, Wilde M, Madden B. Pulmonary function tests. Ulster Med J., 2011; 80(2): 84-90
- Hyatt RE, Scanlon PD, Nakamuro M. Intepretation of pulmonary function tests. 4th ed. Wolters Kluwer Health; 2014.
- Miller RD. Miller’s Anesthesi. 7th ed. Churchill Livingstone Elsiever; 2009
- Barash PG, Cahalan MK, Stoelting RK et al. Clinical Anaesthesia. 7th ed. Wolters Kluwer Health, Lippincott Williams and Wilkins; 2013.
- Lumb AB. Nunn’s Applied Respiratory Physiology. 8th ed. Elsiever; 2016