Ultrasound technology has been developed very rapidly in last few decades. The use of this technology in anesthesiology and emergency medicine has increased by leaps and bounds in last decade. Even anesthesiology post graduate course in our country has incorporated ultrasonography (USG) training as part of curriculum recently. Use of USG in anesthesia will become routine in near future for the obvious reasons of utility and safety in the patient management in routine as well as emergency situation. Ultrasound guided regional anesthesia is slowly gaining popularity and it will probably be the only technique in the future in India as well similar to developed nation.
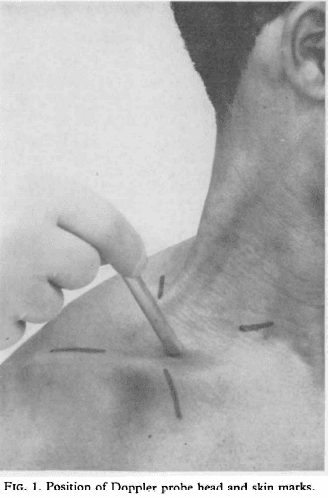
The first reported use of ultrasound was in 1978 by P. La Grange et al when they used Doppler ultrasound (Fig. 1) to localize the third part of subclavian artery and administered brachial plexus block by supraclavicular approach. In 1994, S. Kapral et al first time reported USG guided brachial plexus block after visualisation of the anatomy of plexus in supraclavicular region.
Until the start of second decade of this century, the use of USG has spread into other areas apart from regional anesthesia like – neuraxial and pain services, vascular access, point of care ultrasound (POCUS), airway assessment and of course trans-esophageal echocardiography.
Ultrasound is a high frequency sound with mechanical vibrations above 20 KHz. Human ear can detect sounds between 20 Hz t0 20 KHz. Frequencies below 20 Hz are called as infra sound and elephants can communicate with each other using this frequency. Bats & Dolphins can produce and hear ultrasound between 20 KHz to 100 KHz. Above 100 KHz, naturally occurring frequencies are not present. Medical devices using ultrasound have frequency range between 2 to 15 MegaHz (2000 KHz to 20,000 KHz). Then, how are these frequencies generated? The answer lies in Piezo-Electric effect.
Piezo-Electric effect:
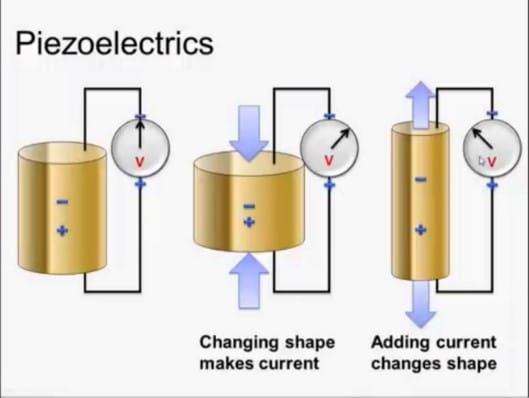
In 1880, French Physicists Pierre curie and Paul-Jacques Curie developed piezoelectric materials which could generate and receive mechanical vibrations. This material is made up of Lead Zirconate Titanate elements. Changing the shape of such elements produces current and conversely if current is applied to piezoelectric elements, they change shape (Fig 2). Individual Piezoelectric material produces small amount of energy. Stacking of such elements into layers in the transducer can convert electrical energy into mechanical oscillations & vice versa.
Speed of Ultrasound in tissues:
Ultrasound requires medium to travel and cannot pass through vacuum. The speed of ultrasound varies in different body tissues. The average speed in body tissues is 1540 meter/second. Bones and air are enemies of ultrasound as these waves cannot pass through these structures and this feature is used to our advantage during ultrasound scanning in regional anesthesia. Higher the frequency of ultrasound, lesser is the tissue depth penetration; but better is the quality/resolution of the image.
Nature of sound waves in tissues:
- Sound wave is mechanical wave produced by the vibrating object and propagated through a medium
- Sound wave is a pressure wave with repeating patterns of high and low pressure regions
- Sound wave is a longitudinal wave where motion of particles is in parallel to direction of energy transport
Ultrasound, in the form of a pulsed beam, propagates from the surface of the transducer into soft tissue. Sound waves are absorbed in part by tissue but are also reflected back to the transducer where they are detected. As the depth increases, ultrasound waves get attenuated because of loss of amplitude and cannot get reflected back to the transducer. Increasing the amplitude at same frequency beyond the depth of attenuation helps in visualising the structures which were initially non visible. This process is called as Time Gain Compensation (TGC).
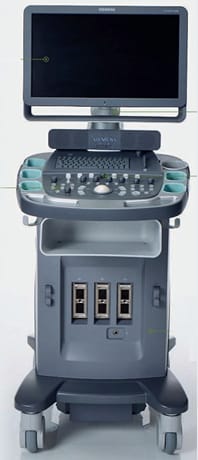
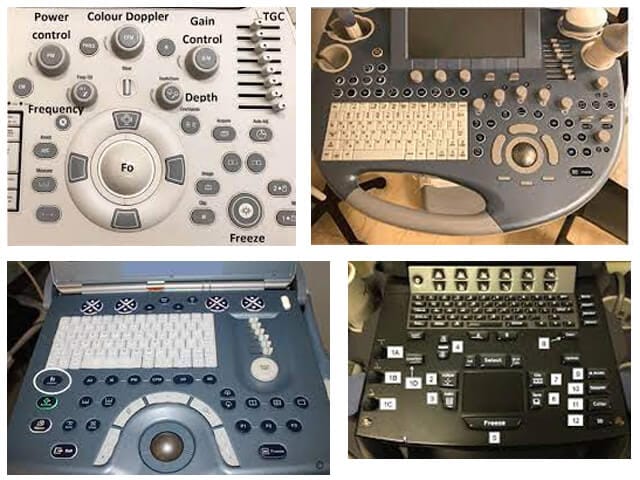
Components of Ultrasonography machine: (Fig 3 and 4)
Every USG machine constitutes three parts: 1) Monitor/Screen, 2) Console and 3) Probes
Console has power input, single or multiple probes attachment site and control panel.
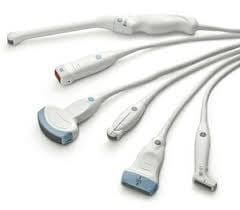
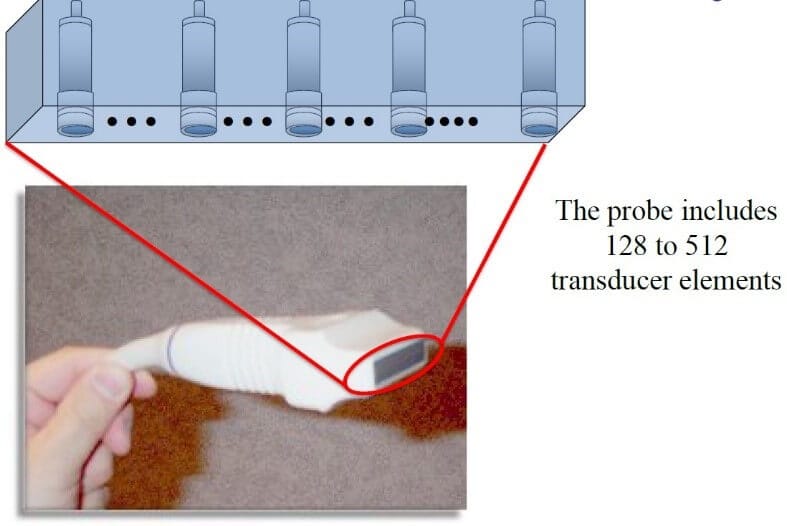
The control panel (Fig 5) of every USG machine can be different with similar or lesser or more functions. But the operator should be knowing the minimum required keys and control for regional anaesthesia conduction. In regional aesthesia practice, linear probe and curved probe are used. The probe includes 128 to 512 piezoelectric transducer elements (Fig 6). The probe acts as source of ultrasound waves as well as receiver of reflected waves.
Linear probe (Fig 7) is a high frequency probe with frequency range between 5 to 12 MHz. The transducers of high frequency have thin piezoelectric elements that generate pulses of short wavelength. The depth of penetration with this probe is about 5 cm; so mainly used for visualising shallower structures. The image seen on the screen with linear probe has rectangular. High frequency probes give good resolution of image. Resolution is defined as the ability of the device to differentiate two closely situated objects as distinct structures.
Orientation Marker on the probe corresponds with the dot/marker on the screen.
Curved or curvilinear probe (Fig 8) is a low frequency probe with frequency range between 2 to 6 MHz. The transducer generates pulses of longer wavelength. The depth of penetration is high; so mainly used for visualising deeper structures. But the image resolution is low. The ultrasound waves are divergent with curved probe; so is the image on the screen which looks sectoral.

Modes of Ultrasound:
- A Mode: This is the oldest ultrasound technique which uses single piezoelectric element. The formed image is one dimensional. This mode is not used in regional anaesthesia
- B Mode: This is the primary mode used in regional anaesthesia. The formed image of scanned area is two dimensional. There is linear array of 100 to 300 piezoelectric elements.
- Doppler Mode: This is named after the Austrian Physicist, Johann Christian Doppler. The main use of this mode is to detect vascular flow. At stationary position, sound frequency is constant. Moving sound source causes change in frequency as well as wavelength with respect to sound receiver. This effect is called as Doppler shift.
If sound source moves towards receiver, sound waves have to be squeezed and that results in high pitched sound called as Positive Doppler Shift.
Conversely, if sound source moves away from the receiver, sound waves are stretched resulting in low pitched sound called as Negative Doppler Shift.
Power Doppler mode is up to 5 times more sensitive in detecting small blood vessels. It does not provide information about direction of the flow.
Colour Doppler is a colour coded map of Doppler shift superimposed on B Mode image. Red colour indicates flow towards the transducer while blue colour indicates flow away from transducer. - M Mode: (Motion mode) – It gives image with motion signal. Used in cardiology to study heart valves which are depicted in wave like manner. Not useful in regional anaesthesia.
Ultrasound Controls:
Though the USG machine has many switches on control panel, there are few ones which must be known while performing regional anaesthesia.
The list is as follows:
- Power source
- Probe selection
- Depth selection
- Gain – near/far
- T.G.C.
- Focus
- Dynamic Range
- Colour Doppler
- Freeze
Advantages of Ultrasound in regional Anaesthesia:
- Real time ability to visualise neural structures, needle tip advancement and local anaesthetic spread with decreased possibility of nerve damage due to intraneural nerve injection
- Lesser volume/dose of Local anaesthetic requirement
- Repeatability even after drug injection
- Negligible chance of intravascular injection
- Decreased pain from muscular contractions (as seen with PNS)
- Decreased need for rescue analgesia
- Anomalous anatomy can be known
Ultrasound interaction with the tissues:
Sound follows the principles of optics. When ultrasound waves traverse the body tissues, there are multiple interactions during the path like
- Reflection – indicates echogenicity and accordingly gives the type of image..
- Refraction
- Scatter
- Absorption
Refraction and scatter interactions do not have major impact. Heat is generated at the site of absorption. Though in clinical conditions, does not cause harm; but there is potential danger of thermal injury.
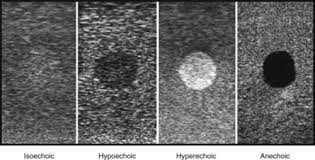
Ultrasound Images: (Fig 9)
- Isoechoic: When the structure of interest has similar echogenicity or appearance as the surrounding tissue, it is called as isoechoic. The structure of interest looks same as surrounding tissue.
- Hypoechoic: When the structure of interest has lesser echogenicity as the surrounding tissue, it is called as hypoechoic. The structure of interest is slightly darker than surrounding tissue.
- Hyperechoic: When the structure of interest has more echogenicity as the surrounding tissue, it is called as hypoechoic. The structure of interest is slightly brighter/white than surrounding tissue. Ex. Bones, pleura
- Anechoic: When the structure of interest has no echogenicity (nothing is reflected back) and it looks black, it is called as anechoic. Fluid filled structures like cysts or blood vessels are anechoic.
Artefacts during ultrasound imaging:
- Shadowing: When ultrasound waves get totally reflected from tissue surface like bone, there is nothing visible beyond the hyperechoic line created by bone surface. This is called as shadowing (Fig 10).
- Enhancement: When ultrasound waves traverse through anechoic structures like cyst or artery, some bright image is formed beyond the distal wall of cyst or artery. This is called as enhancement (Fig 10).
- Reverberation: When highly reflective surface like needle is in the path of ultrasound waves, there occurs tow things. Firstly, waves falling directly on the needle get reflected causing hyperechoic shadow. Secondly, the waves coming back fro distal areas fall on other side of the needle repeatedly and give rise to multiple echogenic images which start fading distally. This is called reverberation (Fig 11).
- Mirror Image: Exact mirror image is seen distally to highly reflective surface. But the resolution is less compared to original image.
- Velocity Error: Due to different sound velocities in various tissues, the needle appears to be bent.

Needling Techniques: (Fig 12)
- In Plane or Long Axis: Needle Shaft is parallel to ultrasound beam and complete needle seen. Needle Tip is visualised as a step. Easier to learn
- Out of Plane or Short Axis: Needle shaft is perpendicular to the ultrasound beam. Complete needle is not seen. The needle part is seen as dot. The visualised part may not always be the tip of the needle.

How to get good ultrasound image?
- Know the anatomy
- Select correct Probe
- Jelly to prevent air interface between probe and skin
- Compound Image mode if available
- Choose proper Depth
- Adjust Focus
- Adjust Gain
- Dynamic Range: 50-100 dB
- P-A-R-T manoeuvre (Pressure – Angulation – Rotation – Tilt)
- Colour Doppler
Perform pre-procedural scan. Use absolute sterile technique and then perform regional anaesthesia block procedure.
By Dr. Saurabh Barde
Consultant Anaesthesia